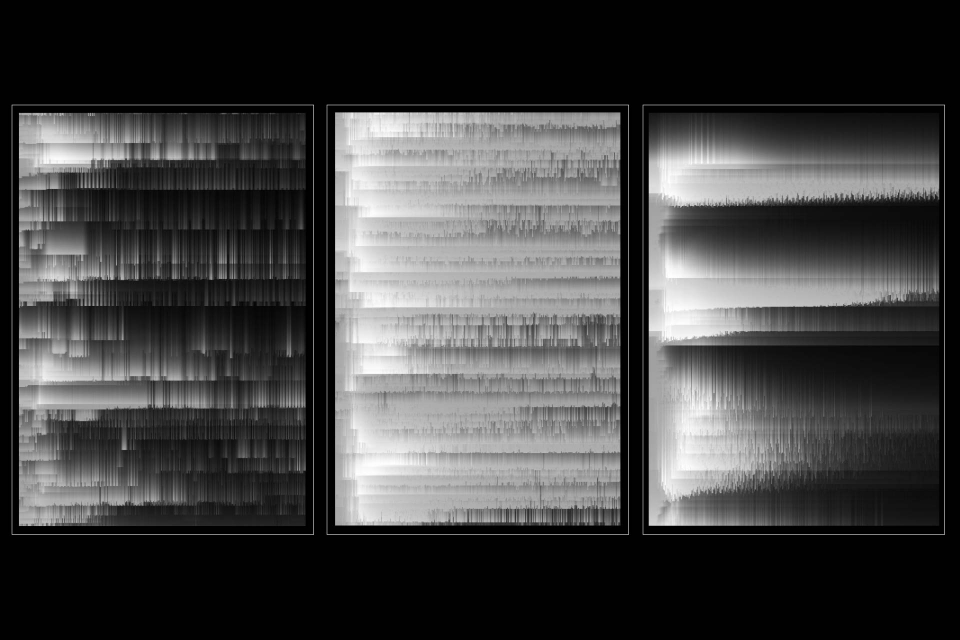
The synergy between sound and image has always been a fundamental component in our projects and for this reason, we constantly explore different strategies of data extraction from sound signal. This research aims at the study and experimentation of new audio analysis techniques to improve the control and generation of real-time graphics through the development of custom patches. In order to manipulate and translate the data extrapolated from the sound, we used Max/MSP by Cycling ’74.
AUDIO DIGITIZATION
Digitization is the process that converts an analog signal into a digital one. In the sound field, this process takes place through sampling, an operation that consists of taking each second with a constant frequency (sampling frequency) of the samples from the original signal. The higher the frequency, the higher the sound reconstruction quality will be. When the sound is sampled, each sample is assigned the amplitude value closest to the amplitude of the original wave.
Our first installations used spectrum analysis, obtaining only amplitudes and frequencies of the sound signal. Thanks to sampling, it was possible to achieve a higher level of precision and synchronization by analyzing even small events and sound details that were lost in the spectrum analysis.
The video shows an example of how the list containing the sampling information can be used, translating the value of each sample into pixels.
SOUND TEXTURE 1D to 2D
One of the main goals of this research was to find new ways to extrapolate data through sampling other than those already tested. In our installations, we use the average of the samples to control different parameters related to the movement of the particles. In this case, we explored the possibility of creating two-dimensional maps through sound and generating vector fields to control positions, speeds, forces, etc. The first obstacle was to understand how to transform the list containing the information of two-dimensional samples, to do this, the sound is recorded in a buffer with a size of 1024 samples, thus sampling 1024 values every 23.22 milliseconds. The data inside the buffer are then converted to grayscale and represented as pixels in a 1Dimensional texture (1024x1 px). The distribution of the pixels on the 2D surface occurs by dividing the initial texture into 32 parts (32x1 px) and placing the new textures on the Y-axis. Finally, the pixels are interpolated to reach a new size from 32x32 px to 512x512 px.


FFT ANALYSIS
Natural harmonics are a succession of pure sounds whose frequencies are multiples of a base note called fundamental note. Through the Fourier transform we can break down a signal into all its sinusoidal components and visualize the harmonic structure of a sound. Using the FFT algorithm (optimized to calculate the discrete Fourier transform), we have created a spectrum analyzer that displays the frequency values on the Y-axis and the evolution of sound over time on the X-axis.
CEPSTRAL ANALYSIS
In signal theory, the cepstrum is the result of the Fourier transform applied to the spectrum of a signal. Through the cepstral analysis, it's possible to create a patch that allows to trace the fundamental note of a signal. If the sampling frequency is 44100 and there is a high peak in the cepstrum with 100 samples, the peak indicates the presence of a pitch at the frequency of 441Hz (44100/100 = 441 Hz).
inlets = 1;
outlets = 5;
function list()
{
var a = arrayfromargs(arguments);
ListAmp = a;
SpectrumSize = a.length;
outlet(0,ListAmp);
outlet(1,SpectrumSize);
}
function bang(){
var maxValueIndex = 0;
var freq = 440;
for(var i = 0; i < SpectrumSize; i++)
{
if (ListAmp[i] > ListAmp[maxValueIndex])
{
maxValueIndex = i;
}
freq = (44100 / (maxValueIndex + 1));
outlet(2,maxValueIndex);
outlet(3,freq);
}
ampiezzaMax = ListAmp[maxValueIndex]
outlet(4,ampiezzaMax);
}
BARK SCALE
The Bark scale is a psychoacoustic scale theorized by Eberhard Zwicker in 1961 and takes the name of Heinrich Barkhausen who proposed the first subjective measurements of the volume (loudness). The scale corresponds to the first 24 critical hearing bands. We have recreated and displayed this scale by implementing the Bark = [(26.81f) / (1960 + f)] - 0.53 algorithm applied to the frequency bands extracted from the FFT analysis via the Max pfft ~ object.
CHROMAGRAM
In music, the chromogram relates to the twelve different pitch classes and is used to analyze and capture the harmonic and melodic characteristics of music. For this analysis, we used Chromagram, an external object developed in Max that generates a list containing the chromatic values of the 12 tones.
On this data we apply a threshold, obtaining a binary list that is converted into decimal values by obtaining an ID, through a custom object made in javascript. The ID selects the corresponding chord from a list, momentarily limited to major and minor triads.
CODE
CODE
inlets = 1;
outlets = 2;
var a,b,c,d,e,f,g,h,i,l,m,n;
var id;
function list(){
var myArray = arrayfromargs(arguments);
a = myArray[0] * 2048 ;
b = myArray[1] * 1024 ;
c = myArray[2] * 512 ;
d = myArray[3] * 256 ;
e = myArray[4] * 128 ;
f = myArray[5] * 64 ;
g = myArray[6] * 32 ;
h = myArray[7] * 16 ;
i = myArray[8] * 8 ;
l = myArray[9] * 4 ;
m = myArray[10] * 2 ;
n = myArray[11] * 0 ;
id = a+b+c+d+e+f+g+h+i+l+m+n ;
outlet(0, id);
}
CHORD LIST
2192, C_Major;
2320, C_Minor;
1096, Db_Major;
1160, Db_Minor;
548, D_Major;
580, D_Minor;
274, Eb_Major;
290, Eb_Minor;
137, E_major;
145, E_minor;
2116, F_Major;
2120, F_Minor;
1060, Gb_Major;
1058, Gb_Minor;
529, G_Major;
530, G_Minor;
2312, Ab_Major;
265, Ab_Minor;
1156, A_Major;
2180, A_Minor;
578, Bb_Major;
1090, Bb_Minor;
289, B_Major;
545, B_Minor;
